Chapter 4 - Excess Carriers and Relaxation
ECE 4339
Han Q. Le
(copyrighted) U. of Houston
0. Physical constants or frequently used formulas
Overview
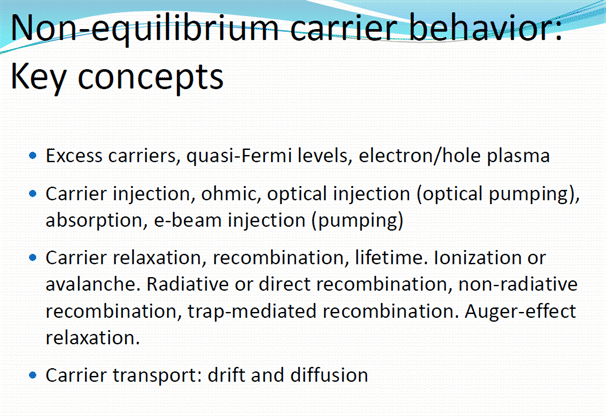
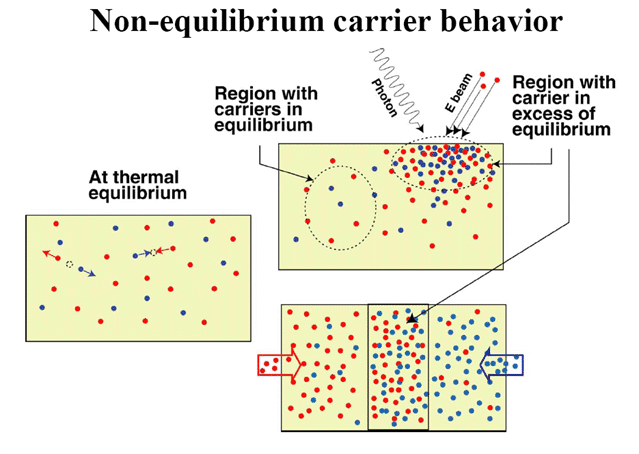
1. Excess carriers and quasi-Fermi levels
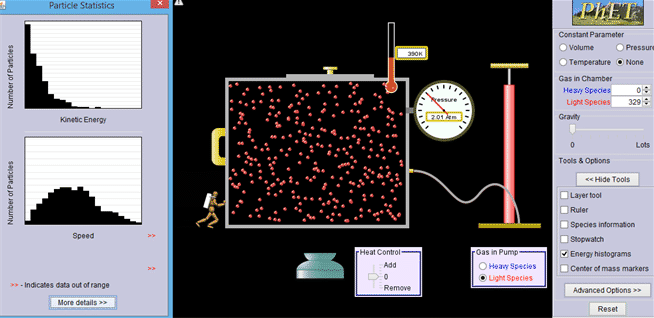
Introductory concept. Behavior of gas molecules when additional population is introduced.
http://phet.colorado.edu/en/simulation/gas-properties
1.1 Fermi-Dirac statistics - review only
1.2 Density of states - review only
1.3 Carrier concentration and Fermi level at equilibrium - review only
1.4 Carrier concentration and quasi-Fermi levels (non-thermal equilibrium)
App Demo: Carrier Concentration and Distribution - Non-thermal equilibrium with Quasi-Fermi Levels

1.5 Advanced topics: 2D systems, quantum well and lasers.
A quantum has a 2D density of state, which is
actually a lot simpler than 3D. It is constant for each energy
level and step up like a staircase:
where ![]() is a uit-step function with a broadening edge.
is a uit-step function with a broadening edge.
Example, a QW has 2 energy levels
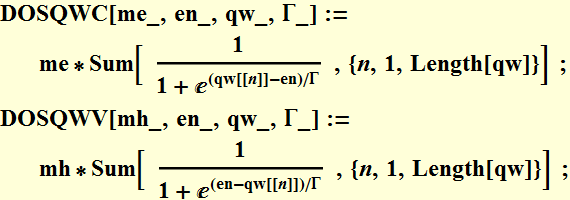
App Demo: Density of State of a 2D System (Quantum Well)
The App Demo below shows how you can move the
conduction band Fermi level and valence band Fermi level to affect
the population in each band.
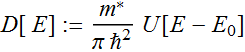
Carrier density
relation: n=∫D[E]
f[E]dE
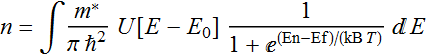
In a laser or LED, the active region where electrons and holes recombine, their population are equal per the principle of charge neutrality, there is a fixed relationship between the 2 Fermi levels.
App Demo: Carrier Distribution of a 2D System (Quantum Well) with Quasi-Fermi Level in Each Band
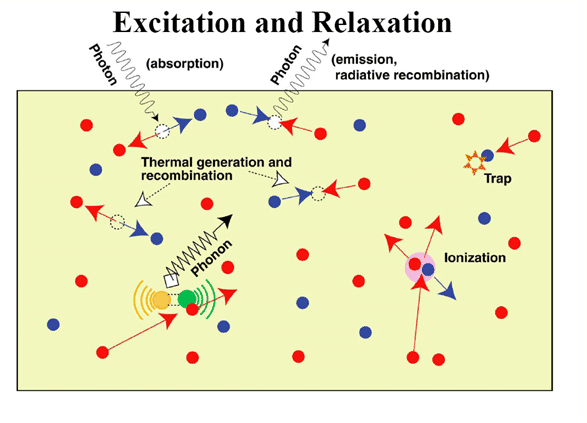
2. Carrier relaxation-microscopic mechanism
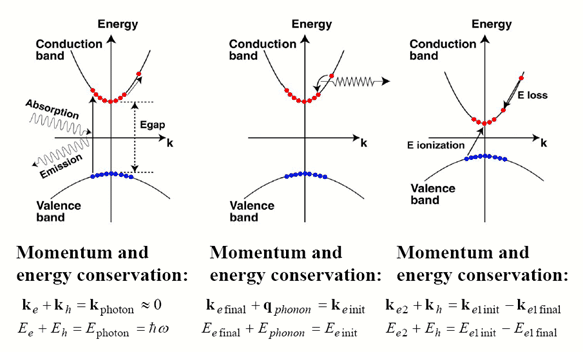
2.1 Absorption
Absorption in materials obeys Beer's Law:
![]()
where P is the transmitted light intensity (or power) and α is the
absorption coefficient.
App Demo: Light Absorption - Beer’s Law
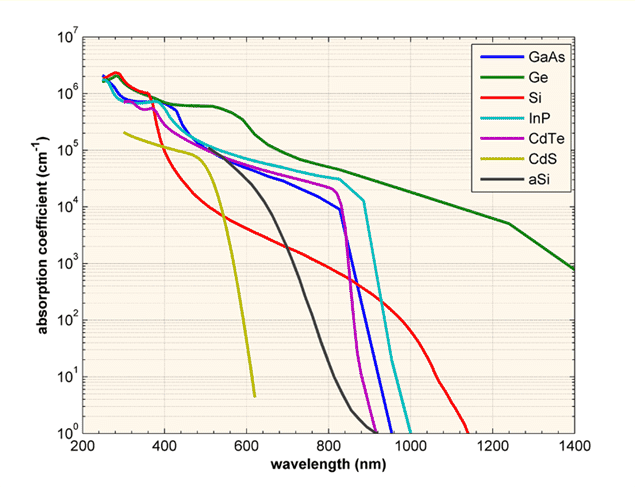
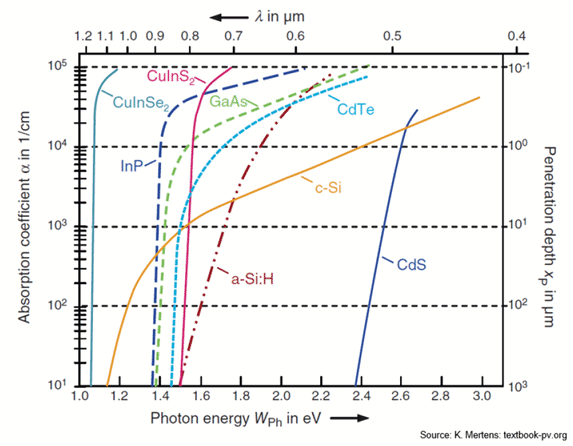
For virtually any material, absorption coefficient
is a function of wavelength λ, expressed as α[λ],Hence:
![]()
For semiconductors, α[λ] is very small below the band gap (no
electron transition from Val to Cond band), and grows very large
very quicky above the bandgap (high density electron transitions
from Val to Cond band).
(source:
http://pveducation.org/pvcdrom/pn-junction/absorption-coefficient)
Plot the transmitted power of a beam of light as a function of semiconductor thickness from 0.1 um to 5 um.
App Demo: Light Absorption in Semiconductor - λ vs. Band Gap
Review of III-V (not including Nitride) and II-VI semiconductors
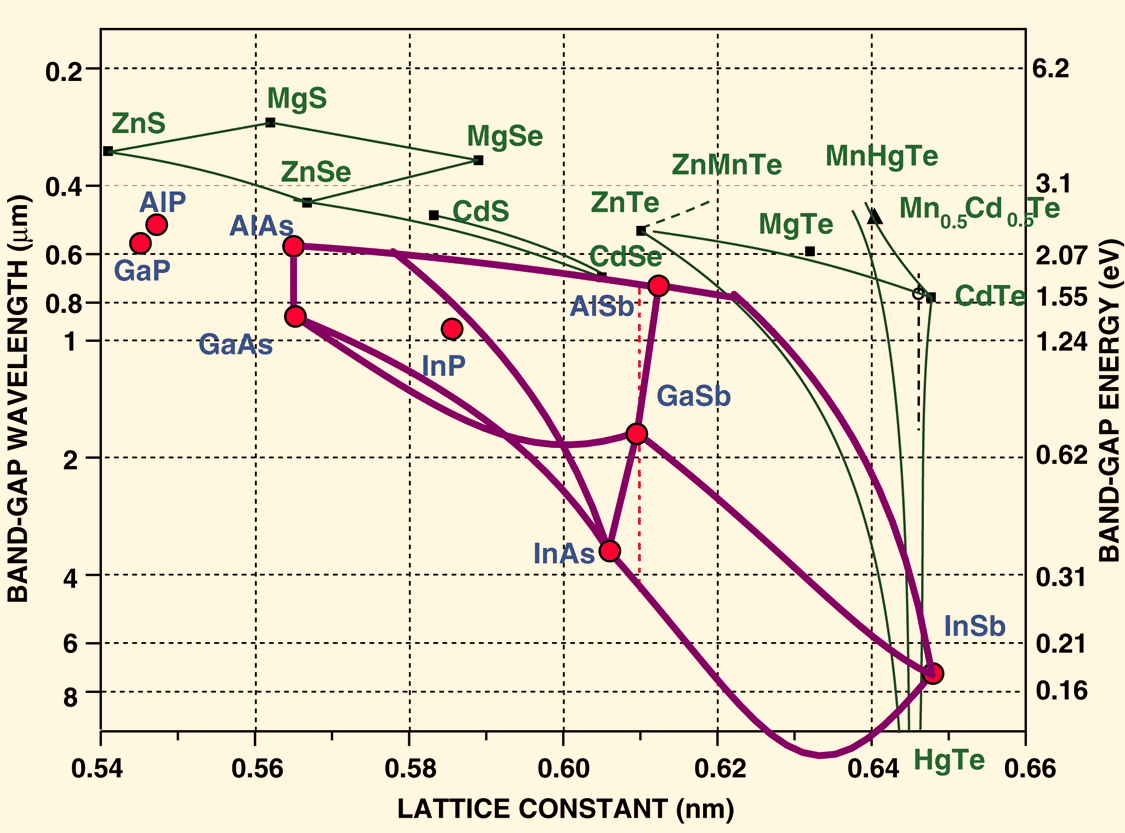
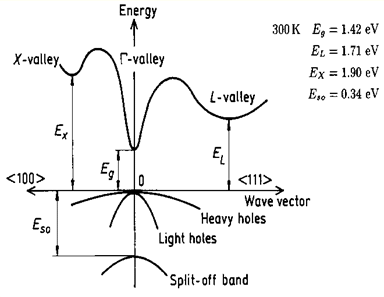
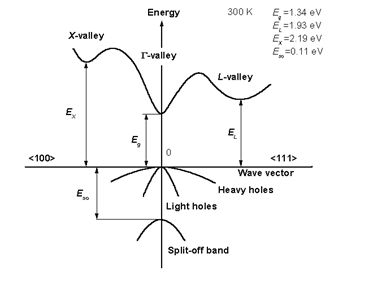
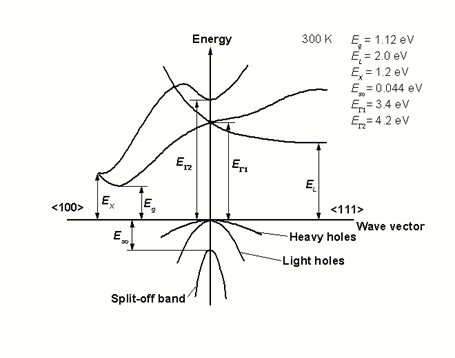
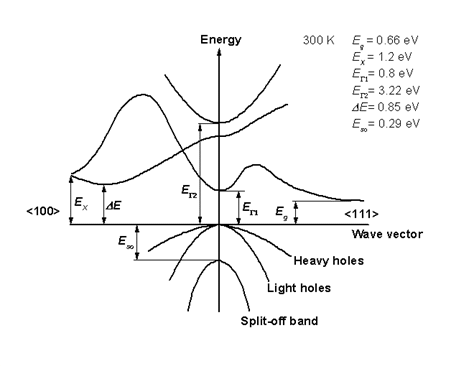
2.1.1 Direct bandgap
When the band extremas are vertically aligned, the bandgap is called direct. Optical transition is strong thanks to momentum conservation
source: http://www.ioffe.ru/SVA/NSM/Semicond/
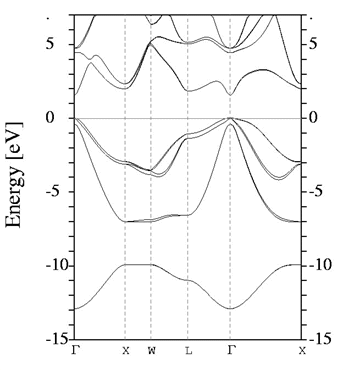
2.1.2 indirect bandgap
When the band extremas are NOT vertically aligned,
the bandgap is called indirect. Optical transition is weak because
a phonon is required to achieve momentum conservation.
Observation of the absorption edge for different SC. Note Si, Ge
vs. the rest. Which ones are indirect and which ones are direct?
Indirect bandgap materials are not good light emitting. They can
still be used as detectors, but not as light emitters.
source: http://www.ioffe.ru/SVA/NSM/Semicond/
2.2 Radiation (emission) - luminescence
2.2.1 Luminescence spectrum
A mechanism for an electron and a hole to recombine
is to emit a photon, called radiative recombination. The
phenomenon of emitting light is called luminescence.
If the luminescence comes from electrical injection, (Ohmic
injection) we call electroluminescence (LED, laser)
If from external light excitation (like from a laser, or a lamp),
we call photoluminescence (optically pumped devices)
If from electron beam excitation (like in a cathode ray tube), we
call cathodoluminescence.
It doesn't matter how we excite, the luminescence spectrum of
different excitation methods are similar to each other, because it
mostly depends on the behavior of electrons and holes that are
relaxed at the band extrema.
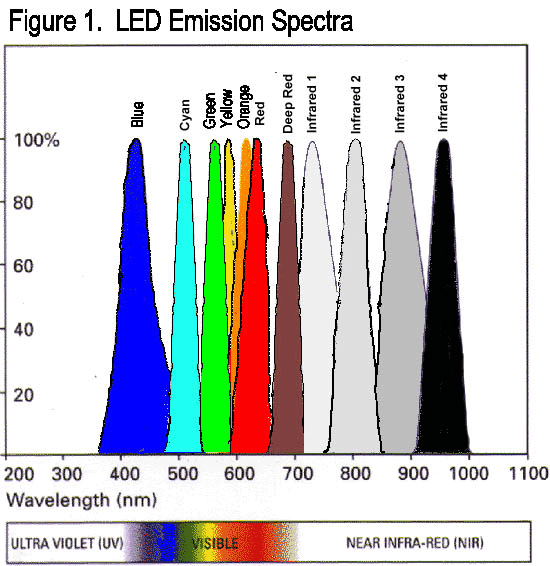
Above: Near-IR (very short-wave IR) LED
 http://mbe.mntl.illinois.edu/workdone.htm
The emission has a strong peak near the band edge, and an
exponentially tapered tail toward higher energy that exhibits the
temperature dependence distribution: ![]() (the tail of Fermi-Dirac distribution). This temperature is the
electron-hole population temperature, which is sometime “hotter”
than lattice temperature, depending on the amount of excess energy
of the excitation.
(the tail of Fermi-Dirac distribution). This temperature is the
electron-hole population temperature, which is sometime “hotter”
than lattice temperature, depending on the amount of excess energy
of the excitation.
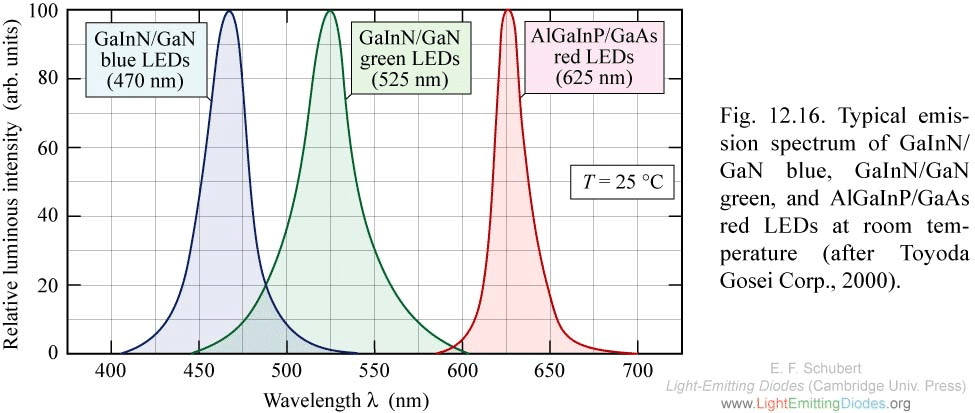
By looking at the emission peak, you can roughly tell the band gap
of a semiconductor. A more accurate spectral line fitting, as well
as low temperature measurements can give very accurate bandgap
value.
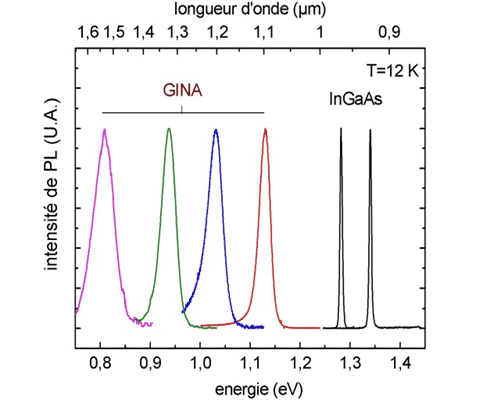
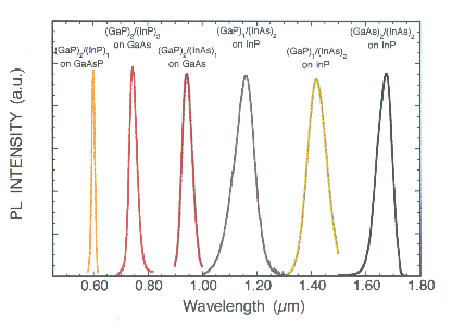
The above example shows emission spectra from different semiconductor alloy. Shown is the InGaAs luminescence. The others are GaInNAs.
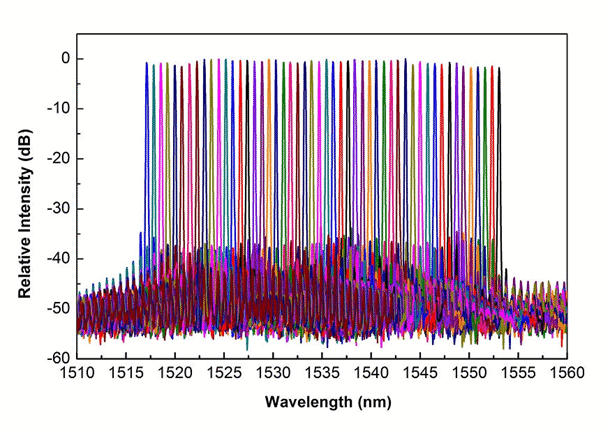
Above: Laser spectra for long haul optical communications
2.2.2 Model for luminescence spectrum
A simple model for the luminescence spectrum is
so-called k-conservation model, in which each electron recombines
only with hole of the opposite momentum. Then, the emitted energy
is:
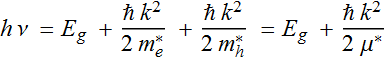
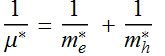
where ![]() is defined as the effective reduced mass of the electron-hole
pair:
is defined as the effective reduced mass of the electron-hole
pair:
Let 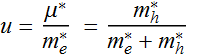
Then: 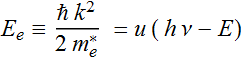 ;
;
The spectrum is simply the density of occupied electrons and holes
at momentum k.
Thus: ![]()
Here is the case we often have different
electron and hole fermi levels.
Here, the QW bandgap is the bulk bandgap + quantum
well energy.
We will plot the density of state
The density of
state: 

Example: emission from ![]() QW LED or laser under lasing threshold
QW LED or laser under lasing threshold
Below is an illustration of emission from ![]() (using
QW model for convenience, but the QW energy levels are set at ~ 0)
(using
QW model for convenience, but the QW energy levels are set at ~ 0)
App Demo: Illustration of GaAs/AlGaAs QW LED or Subthreshold Laser emission
2.2.3 Illustration
Why do we care about luminescence from electron-hole recombinations?
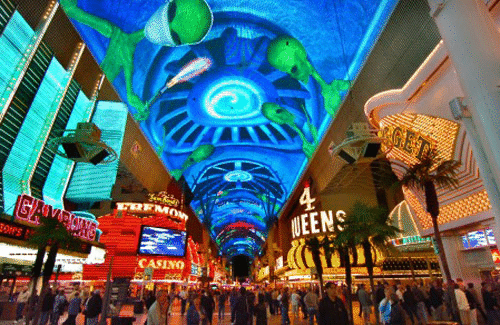
Once upon a time, noble gases (Helium, Neon, Krypton, Argon, Xenon...) were most importantly used to light up activities that are of somewhat dubious nobility...


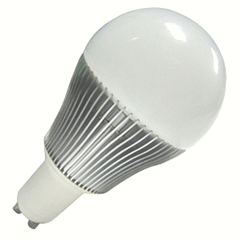
Today, LEDs are relieving these gases from their “nobless oblige”..
LED are used from the theme of worship...
such as LED cathedral
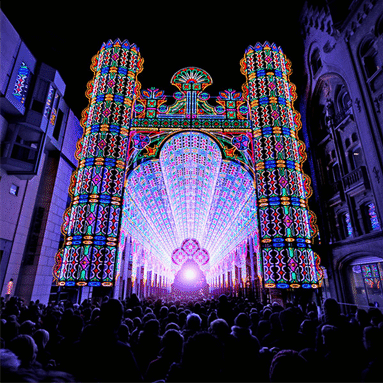
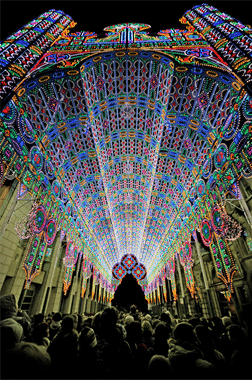
to Sin City...
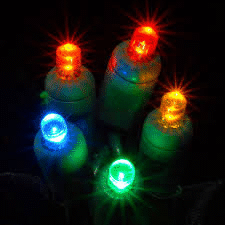
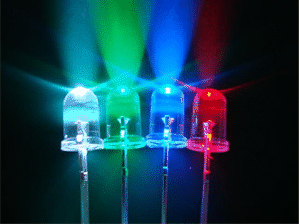
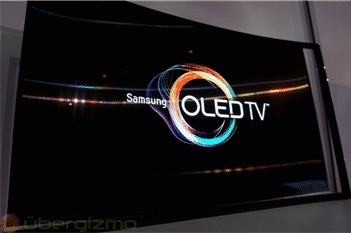
Electron-hole radiative recombination is what gives us
2.3 Other mechanisms:
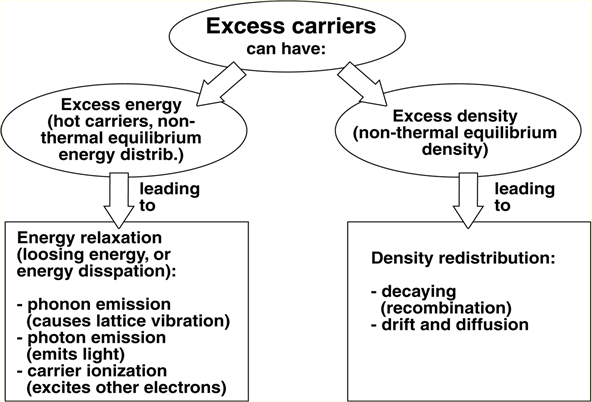
Hot electron relaxation: phonon emission.
Auger recombination (non-radiative)